Well, I joined the masses today and made a graph from the sites DOM structure using the java applet found here. Here it is

I also made one for the main site

and my personal sites


I’m not sure what this exactly accomplishes but it makes nice images.
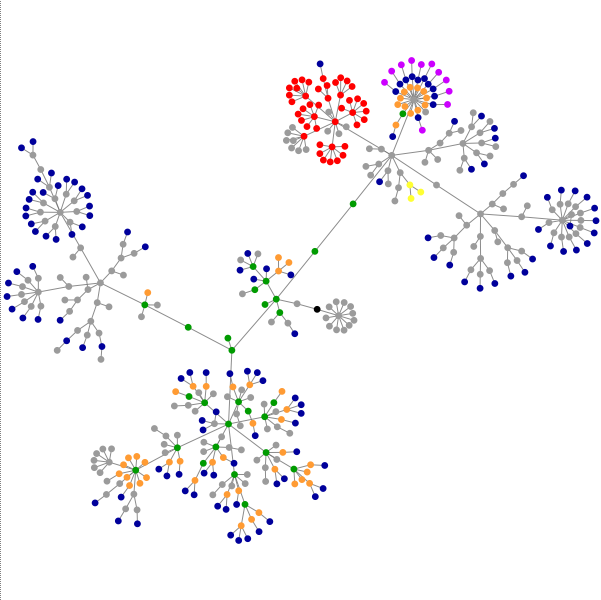
Here is a key for the colors.
blue: for links (the A tag)
red: for tables (TABLE, TR and TD tags)
green: for the DIV tag
violet: for images (the IMG tag)
yellow: for forms (FORM, INPUT, TEXTAREA, SELECT and OPTION tags)
orange: for linebreaks and blockquotes (BR, P, and BLOCKQUOTE tags)
black: the HTML tag, the root node
gray: all other tags